What Happened to the Bounce Rate in Google Analytics 4?

If you are not seeing the bounce rate on the new Google Analytics 4, you are not going crazy; it no longer exists. You might be wondering why Google removed this feature, well, because it simply wasn’t precise enough.
The bounce rate measures the percentage of website visitors who leave without clicking another button on the page. While this metric helps users of the older version of Google Analytics (Universal Analytics) to get an idea of visitor engagement on their platform, analyzing the bounce rate alone often leads to misleading conclusions and distorts the representation of actual visitor engagement. Let me explain.
What is the Engagement Rate and How is it Measured?
In terms of measuring engagement, the bounce rate was the best thing Universal Analytics had to offer. In reality, the bounce rate was just a simple indicator. A high percentage meant that users were not interacting with the site, whereas a low percentage indicated that they were “possibly” interacting with it. The hiccup here is that for most websites, a user can experience a successful visit and still “bounce back” by being satisfied with what they found.
Moreover, if users tend to keep several tabs open (guilty as charged!), it does not necessarily mean that they are actively “engaging” with your site. That's why Google decided to stop offering the bounce rate and average session length in the new version of its analytics tool and to use engagement metrics instead
Bounce Rate Alternatives in Google Analytics 4
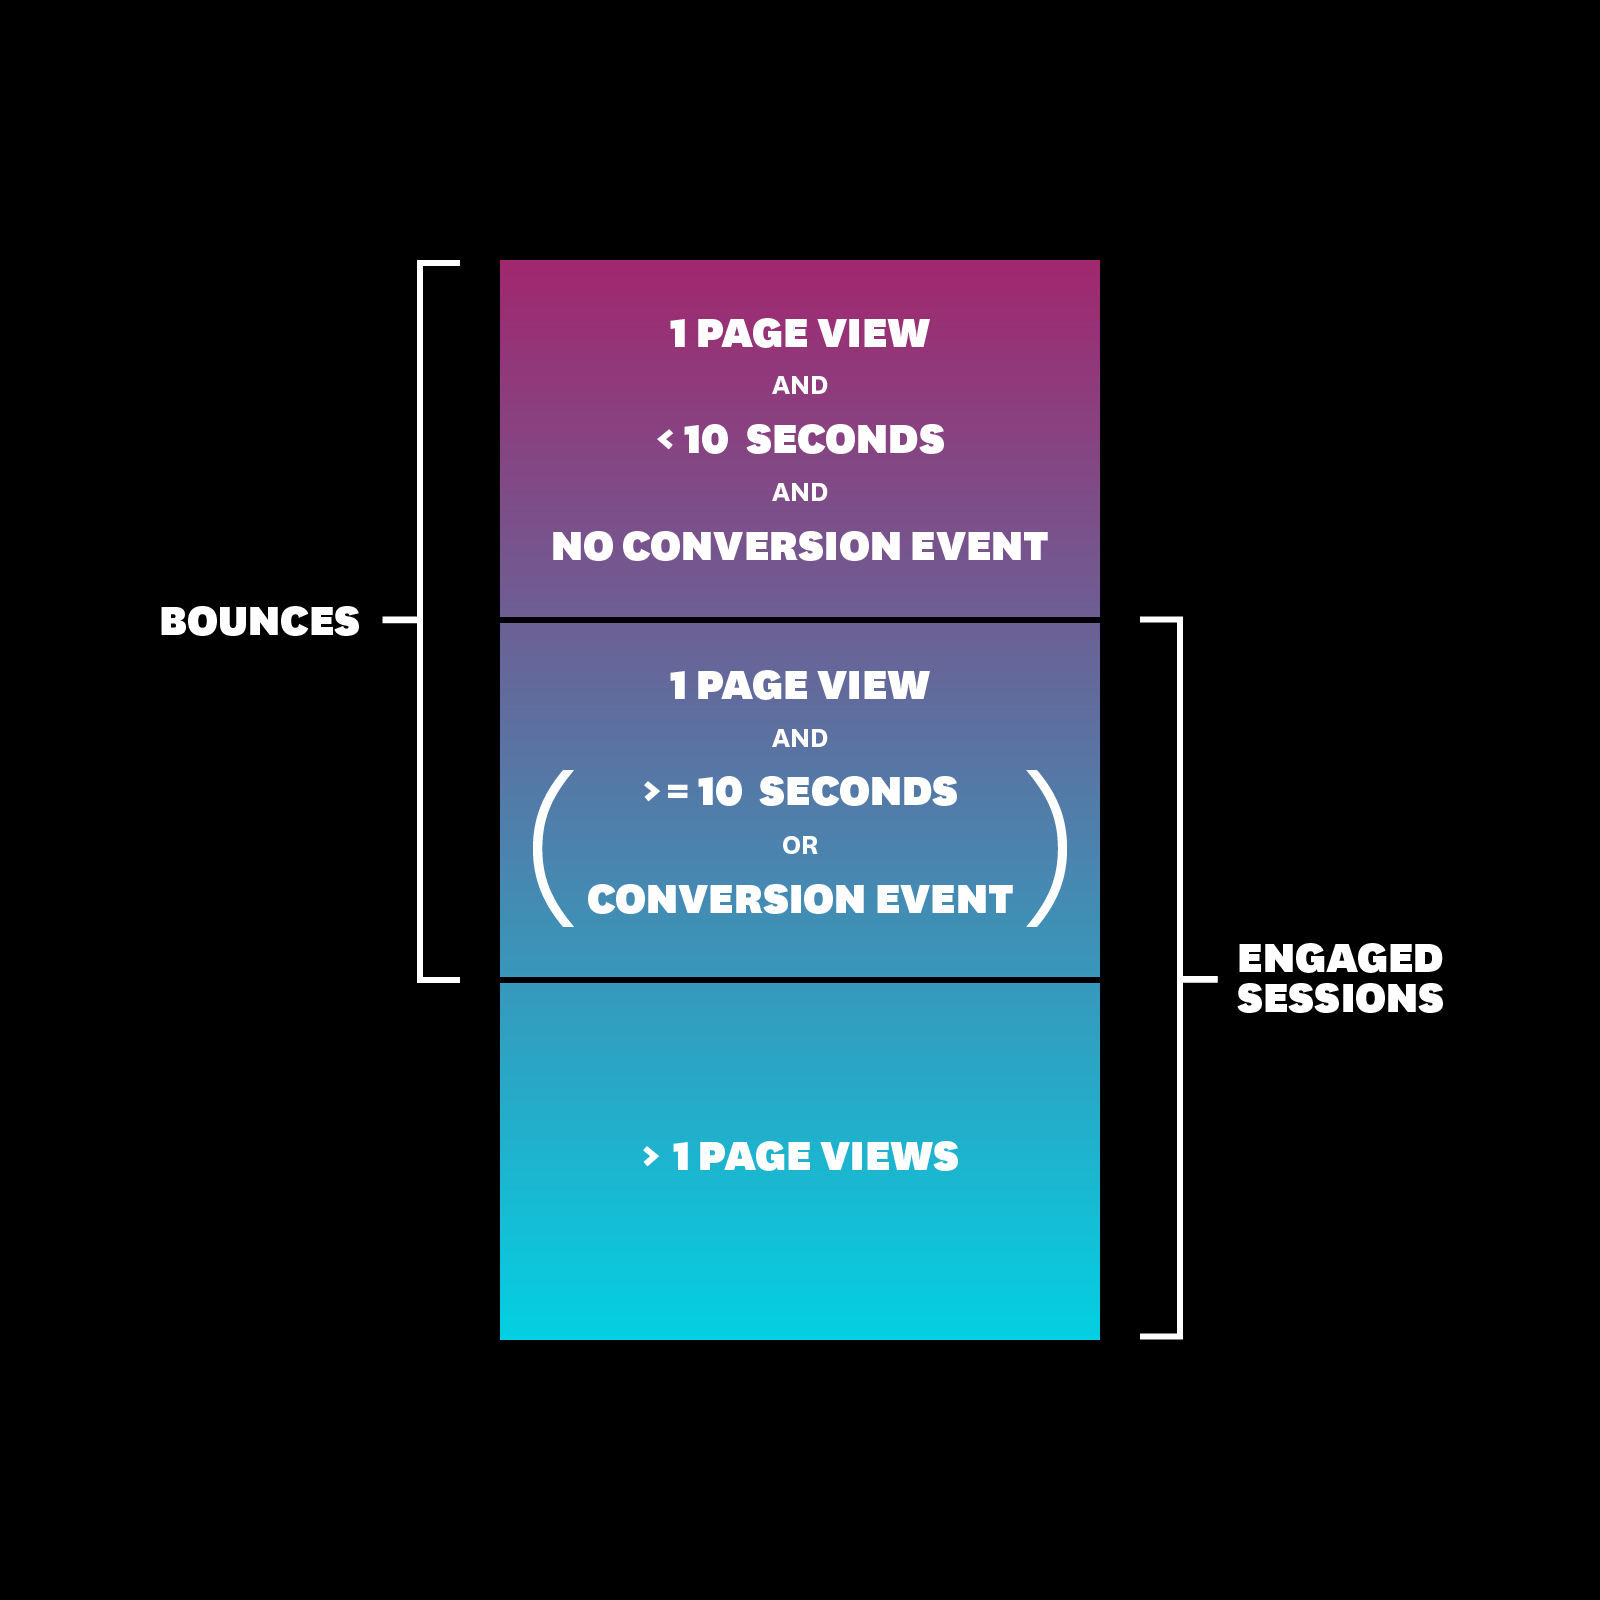
In Google Analytics 4, the bounce concept is replaced by that of “engaged session”. For a session to be considered engaged, the user must do at least one of the following during a single visit:
- Actively interact with your website or app for at least 10 seconds
- Generate a conversion
- Generate at least two new windows or page views
In addition to the engagement rate, other statistics based on this feature are available to you in Google Analytics 4, such as:
- Engaged sessions: how many sessions resulted in one or more of the above criteria
- Engagement rate: number of engaged sessions / total number of sessions
- Engaged sessions per user: number of engaged sessions / total number of users on your site and mobile apps
- Engagement time: the total amount of engagement time on your website and mobile apps
The Benefits of Measuring the Engagement Rate Instead of the Bounce Rate
The engagement rate is, without a doubt, a much more useful metric than the bounce rate. Instead of simply indicating how often users leave (or bounce back), the feature provides tangible information about how often the users stay and are active on your website. This feature is particularly beneficial where the bounce rate is no longer useful. We are referring to mobile apps, single-page sites and content platforms such as blogs and news sites, for example, where the visitor often leaves after finding the content they are looking for.
While this is a significant change, the user behaviour data provided by the engagement rate metric will allow you to better understand the traffic on your website and will certainly help you make more informed decisions. As you go through the Google Analytics 4 reports, the engagement rate will become a key part of your understanding. You will almost forget that the bounce rate ever existed.
- Log in to post comments